Ada user guide
Table of contents
Overview of Ada
Ada, short for AI Data Analyst, is BoostKPI’s custom GPT designed to help users analyze their datasets and see some of BoostKPI’s power and functionality. Ada can help you analyze timeseries csv files of roughly one million rows containing KPI data semiaggregated across a set of dimensions. A simple dataset that it can help analyze might look like:
date, country, revenue
2024-01-01, US, 100
2024-01-01, IN, 125
2024-01-02, US, 150
2024-01-02, IN, 80
Ada comes equipped with several demo datasets covering use cases such as ecommerce, adtech, subscriptions, facebook marketing, and data quality monitoring. Alternatively, you can upload a dataset of your own for analysis by following the instructions in the Ada dataset import guide.
Ada’s analysis tool
Like all GPTs, Ada can write and execute code to analyze your csv files. Ada, however, comes equipped with a subset of BoostKPI’s powerful analysis tools to help you further dive into and understand your KPIs.
Dimension breakdown
If you ask Ada for a dimension breakdown table, it will provide you with a table showing how a KPI has changed between two periods broken down across each of the dimensions in your dataset and how each dimension value has contributed to the overall KPI change. This table can be very useful for quickly identifying which dimension values are responsible for top level change in a KPI.
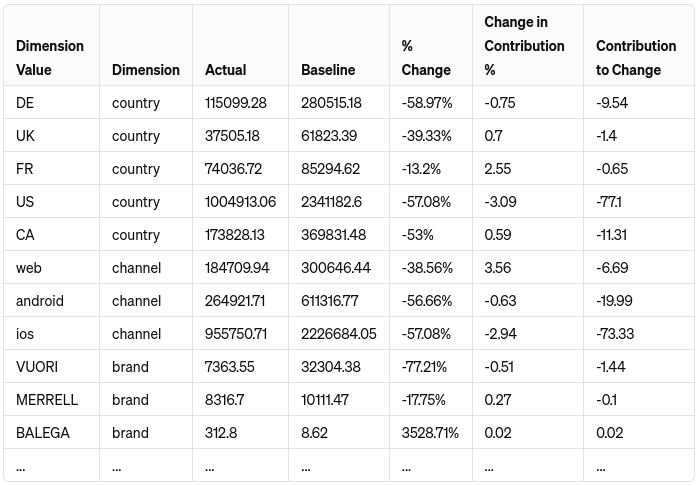
In addition to the actual and baseline KPI values for each dimension value, the table also shows the percent change between the time periods, the change in overall contribution percent, and the percent the dimension contributed to the overall change. Change in contribution represents the change in what fraction of the overall KPI value that dimension value contributed, while contribution to change measures how much the change in the KPI for the dimension value contributed to the overall change in the KPI.
Try seeing which dimensions caused the increase in spend between the last two weeks of October 2020 and the prior month in our demo adtech dataset. Note that this time range is around the 2020 US elections.
KPI breakdown
The KPI breakdown table is similar to the dimension breakdown table, but instead of breaking down one kpi by every dimension, the KPI breakdown table breaks down every kpi by one dimension. This allows you to see how an important dimension is contributing to KPIs across your business.
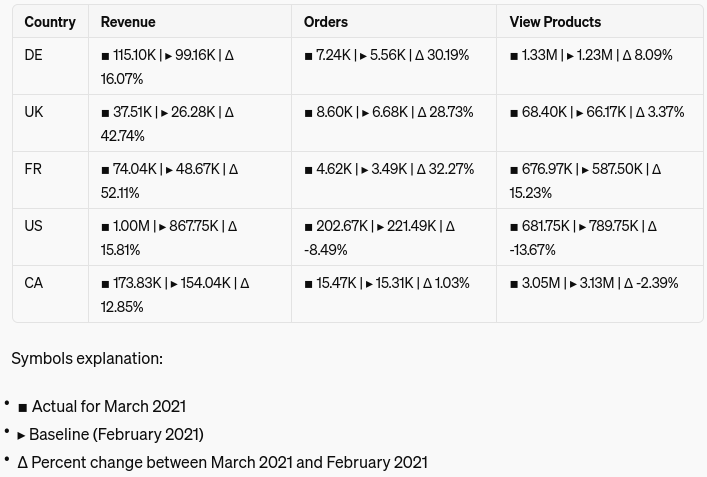
Try using the KPI breakdown to see how different marketing channels have performed between March 2021 and February 2021.
Drilldown
Ada can also show you BoostKPI’s drilldown table which attempts to drilldown to find dimension combinations that have seen significant change. This table is designed to try and find interesting changes among fine slices of your data where “interesting” is a combination of the percent change and magnitude change.
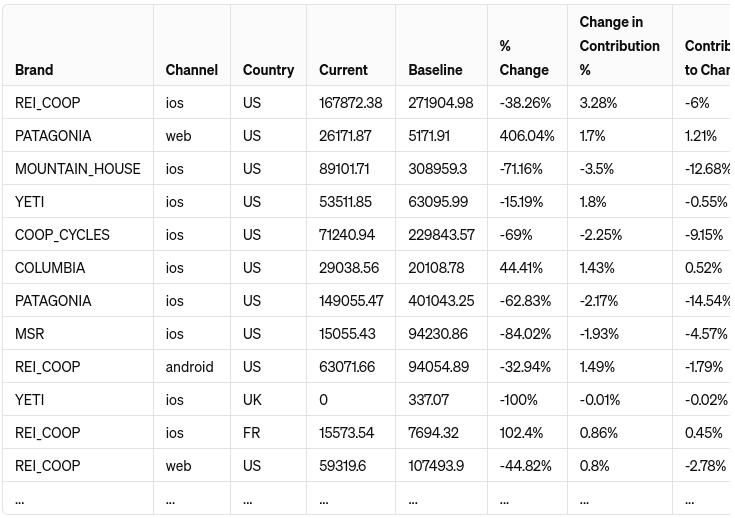
The drilldown table shows the same data as the dimension breakdown table, but refined to a tighter granularity. You may notice that sometimes the first few columns might contain values of ALL or OTHER. These values represent dimension combinations that our drilldown algorithm has chosen to “rollup” because the grouped values behaved similarly.
Try drilling down into what caused revenue to increase during the last two weeks of March 2021 compared to three months earlier in our demo ecommerce dataset.
Limitations
Due to the nature of OpenAI’s custom GPTs and the one-off chat based interface, Ada does not support of all of BoostKPI’s functionality. It does not support derived metrics such as average order value, certain filters and options for more flexible analysis in the provided tools, nor some of the advanced visualization from BoostKPI’s dashboard. Additionally, because Ada works with one time csv uploads and not ongoing data imports, it does not support any of BoostKPI’s suite of anomaly detection tools.
If you are interested in any of our expanded functionality or want to learn more about BoostKPI can help you, please send an email to contact@boostkpi.com asking to set up a demo meeting.
FAQ
How should I ask Ada to use one of BoostKPI’s analysis tools (dimension breakdown, kpi breakdown, or drilldown)?
BoostKPI’s tooling works by comparing KPI values across two time periods. When asking Ada to present you with a table, make sure to include the two time periods in your request. For example, don’t ask “Show me a dimension breakdown for my revenue”, instead say “Show me a dimension breakdown for my revenue comparing January 2024 to January 2023.”
Additionally, make sure to specify any parameters for the specific table you would like to see. The dimension breakdown and drilldown both need a specific KPI to analyze, while the KPI breakdown needs a specific dimension.
I’m running into a problem uploading my own csv.
Please see our Ada dataset import guide.
How can I learn about BoostKPI’s other capabilities?
Send us an email at contact@boostkpi.com and we will be happy to set up a demo where we can show you how BoostKPI can help your business.