Miscellaneous
Table of contents
- Why are we named “BoostKPI”
- I have a different question that is not covered here.
- How do I change the charts that are displayed in my dashboard-view?
- Charts on smaller screens
Why are we named “BoostKPI”
We pronounce BoostKPI as Boost-kay-pee-eye. KPI stands for Key Performance Indicator(s) – the key metrics that business stakeholders use to measure, plan, and optimize the business’s performance. Here are example KPIs for different businesses:
- Retail: revenue, AOV (Average Order Value), number of purchases, number of product-views, product-view-to-purchase conversion rates.
- Paid marketing: impressions, clicks, CTR (Click-Through-Rates), purchases, ROAS (Return-On-Ad-Spend),, leads, CPL (Cost-Per-Lead)
The name BoostKPI captures our main goal – make it easier, faster, and cheaper for businesses to boost their KPIs.
I have a different question that is not covered here.
Please email your account manager or email us at contact@boostkpi.com
How do I change the charts that are displayed in my dashboard-view?
To change the charts, click on the dashboard-view, update the charts (or the investigation period, baseline, the granularity of data, or the KPIs being displayed), and save the updated dashboard-view.
The changes should now reflect in the dashboard.
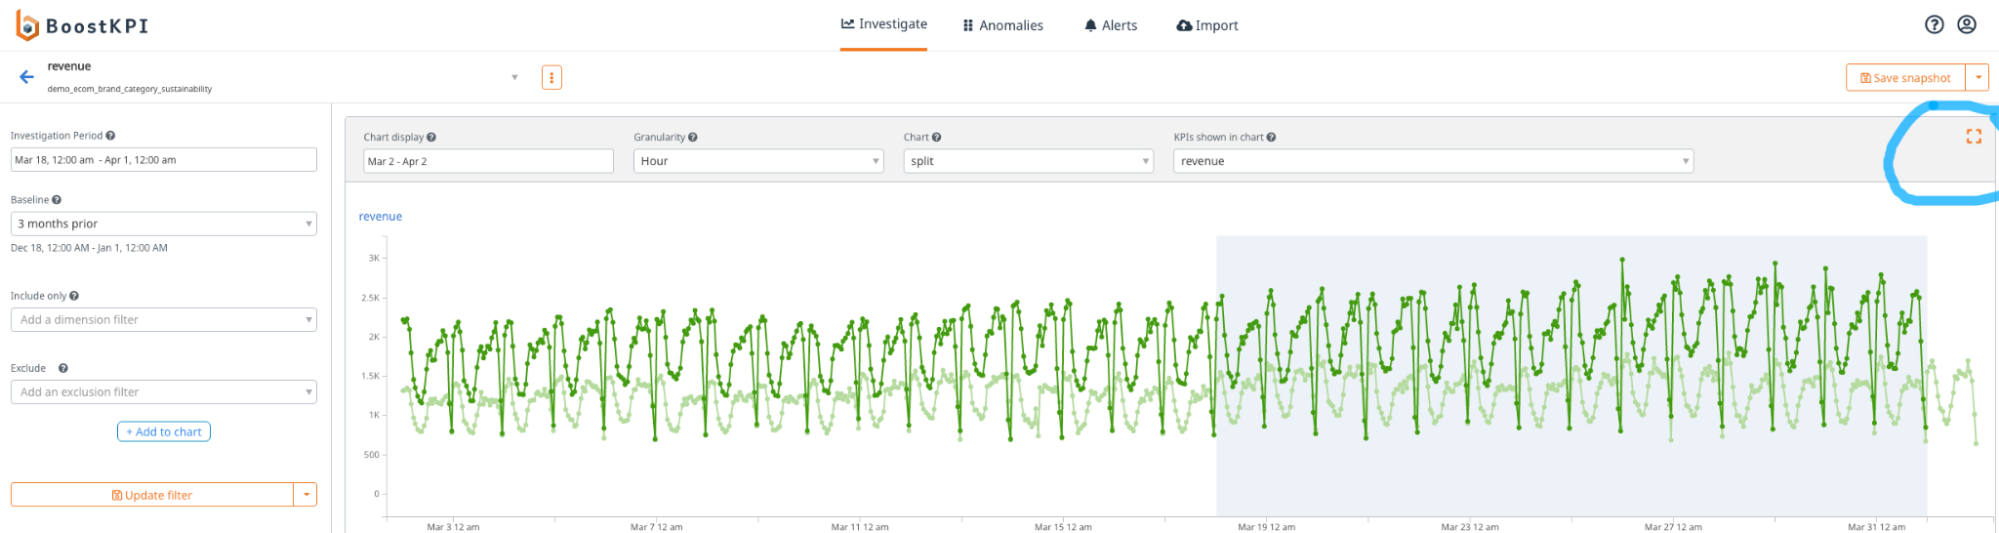
Charts on smaller screens
Q: I’m on a small screen and the chart looks really small. Can I just see the chart in full-screen?
Yes, just hit the rectangle button on the upper right corner of the chart display.