API (EXPERIMENTAL)
Table of contents
- How can I fetch anomalies through the API?
- How can I fetch the drilldown data through the API?
- How can I fetch the overview or heatmap data through the API?
- How do I authenticate when using the API?
How can I fetch anomalies through the API?
BoostKPI provides programmatic access to anomalies. They can be fetched via a GET request to the following endpoint dashboard.boostkpi.com/api/anomalies/json.
The endpoint supports the following query parameters:
anomalyWindowStartandanomalyWindowEnd- Returns anomalies whose duration overlap the provided window, inclusive on the start and exclusive on the end. The timestamps should be provided in milliseconds form, e.g.,Sun Jan 01 2023 00:00:00is1672531200000.createTimeStartandcreateTimeEnd- Returns anomalies that were created between the two timestamps, inclusive on the start and exclusive on the end. The timestamps should be provided in milliseconds form, e.g.,Sun Jan 01 2023 00:00:00is1672531200000.anomalyIds- Returns only the anomalies with the provided ids. The ids should be provided as a comma delimited list of anomaly ids, e.g.,1,2,3.
At least one of the filters is required.
Anomalies are returned grouped by detection in the following json format:
[
  {
    // The name of the detection
    alertName: "foo",
    // The kpi the detection watches
    kpi: "kpi1",
    // A brief description of the detection's behavior
    desc: "Detects changes in kpi1",
    anomalies: [
      {
        // The id of the anomaly
        id: 1,
        // The timestamp when the anomaly began
        start: 1672531200000,
        // The timestamp when the anomaly ended
        end: 1672617600000,
        // The type of the anomaly
        type: "DEVIATION",
        // The value of the kpi during the anomaly
        current: 100,
        // The expected baseline kpi value
        baseline: 200,
        // The dimension slice that the anomaly occurred in
        dimensions: {
          // Name of the dimension, e.g., platform, country, etc.
          dimension_name: [
            // Value of the dimension, e.g., iOS, US, etc.
            "dimension_value"
          ]
        }
      },
      {
        id: 2,
        ...
      },
      ...
    ]
  },
  {
    alertName: "bar",
    kpi: "kpi1",
    ...
  },
  {
    alertName: "baz",
    kpi: "kpi2",
    ...
  },
  ...
]
How can I fetch the drilldown data through the API?
The data in the drilldown table can be fetched by a GET request to ‘dashboard.boostkpi.com/api/dashboard/summary/autoDimensionOrder’.
The endpoint has the following required query parameters:
- ‘metricId’ - the metric id, this can be found in the url by opening an investigation of the metric
- ‘currentStart’ and ‘currentEnd’ - the investigation time range endpoints in milliseconds, takes an inclusive start and an exclusive end
- ‘baselineStart’ and ‘baselineEnd’ - the comparison time range endpoints in milliseconds, takes an inclusive start and an exclusive end
- ‘summarySize’ - controls the analysis complexity, a higher number will take longer to return, we recommend using 25
The endpoint supports the following optional query parameters:
- ‘depth’ - the number of dimensions to breakdown by (default value: 3)
- ‘includedDimensions’ - dimensions to use in the breakdown (defaults to an automated dimensional analysis and selection)
- ‘excludedDimensions’ - dimensions to exclude as options from the automated analysis and selection
The endpoint will respond with data in the following json format:
{
  // The id of the dataset for the provided metric
  datasetId: 2,
  // The metric id from the request
  metricId: 1,
  // Total metric value during the current time range
  currentTotal: 100,
  // Total metric value during the baseline time range
  baselineTotal: 150,
  // The dimensions the summary information will be broken down by, comes either from automatic
  //  analysis or the query param in the request
  dimensions: [
    "dim1",
    "dim2",
    "dim3"
  ],
  responseRows: [
    {
      currentValue: 20,
      baselineValue: 30,
      percentageChange: "-33.333%",
      contributionChange: "5%",
      contributionToOverallChange: "10%",
      // The dimension values for this row
      names: [
        "foo", // Dimension values match in order with the dimensions
        "(ALL)", // "ALL" represents that the summary rolled up the row along this dimension
        "(ALL)-" // "(ALL)-" represents all of the values not present in any other row,
                  // e.g., it might represent the rollup of a long tail of dimension values
      ],
      // The dimension values for any "(ALL)-" entries in the row, may be
      // blank or incomplete for dimensions with high numbers of values
      otherDimensionValues: [
        "bar",
        "baz"
      ],
      // An estimate of the importance of the change in a row, higher is more important
      cost: 1000
    },
    ...
  ],
  gainer: [
    ... // A summary of the cost for high importance single dimension values
  ],
  loser: [
    ...
  ],
  // Costs associated with including particular dimensions in the summary,
  //  higher is more important
  dimensionCost: [
    {
      dimensionName: "dim1",
      cost: 1000
    },
    ...
  ]
}
How can I fetch the overview or heatmap data through the API?
The data in the overview or heatmap table can be fetched by a POST request to ‘dashboard.boostkpi.com/api/rootcause/metric/breakdown’.
The request should have a json body containing:
{
  metric: {
    // The id of the metric, this can be found in the url for an investigation of the metric
    id: 1,
    // Optional dimension filters to use
    dims: [
      {
        // The dimension name to filter
        label: "country",
        // Can be an include or an exclude filter
        included: [
          // The dimension values to filter
          "US", "CA", ...
        ]
      },
      ...
      {
        label: "platform",
        excluded: [
          "iOS"
        ]
      }
    ]
  },
  // The inclusive start of the investigation range as a timestamp
  //  in milliseconds, this timestamp is May 1st, 2023
  start: 1682899200000,
  // The exclusive end of the investigation range as a timestamp
  //  in milliseconds, this timestamp is May 7th, 2023
  end: 1683417600000,
  // A string representing the offset for comparison: "wo1w" to compare to the previous week,
  //  "mo3m" to compare to three months prior, "do1d" to compare to the previous day
  offset: "wo1w",
  // The number of top dimension values to return for each dimension,
  //  values past the limit will be rolled up into other
  limit: 50
}
The endpoint will respond with breakdown data in the following json format:
{
  result_complete: {
    dimension_name1: {
      dimension_value1: {
        // The metric value for dimension_value1 during the start to end time range
        current: 10,
        // The metric value for dimension_value1 during the offset comparison time range
        offset: 8
      },
      ...
      dimension_value50: {
        current: 1,
        offset: 2
      }
    },
    dimension_name2: {
      ...
    },
    ...
  },
  // The overall metric totals, these values can be used to compute the tail
  //  metric values past the requested limit
  totals: {
    // The value of the metric between the start and end time
    current: 100,
    // The value of the metric during the offset comparison time range
    offset: 90
  },
  // An id for internal BoostKPI use
  performanceId: 1
}
How do I authenticate when using the API?
To authenticate to BoostKPI, grab your te_auth cookie while logged into dashboard.boostkpi.com and include it with any requests. See screenshot below on how to grab the te_auth cookie. 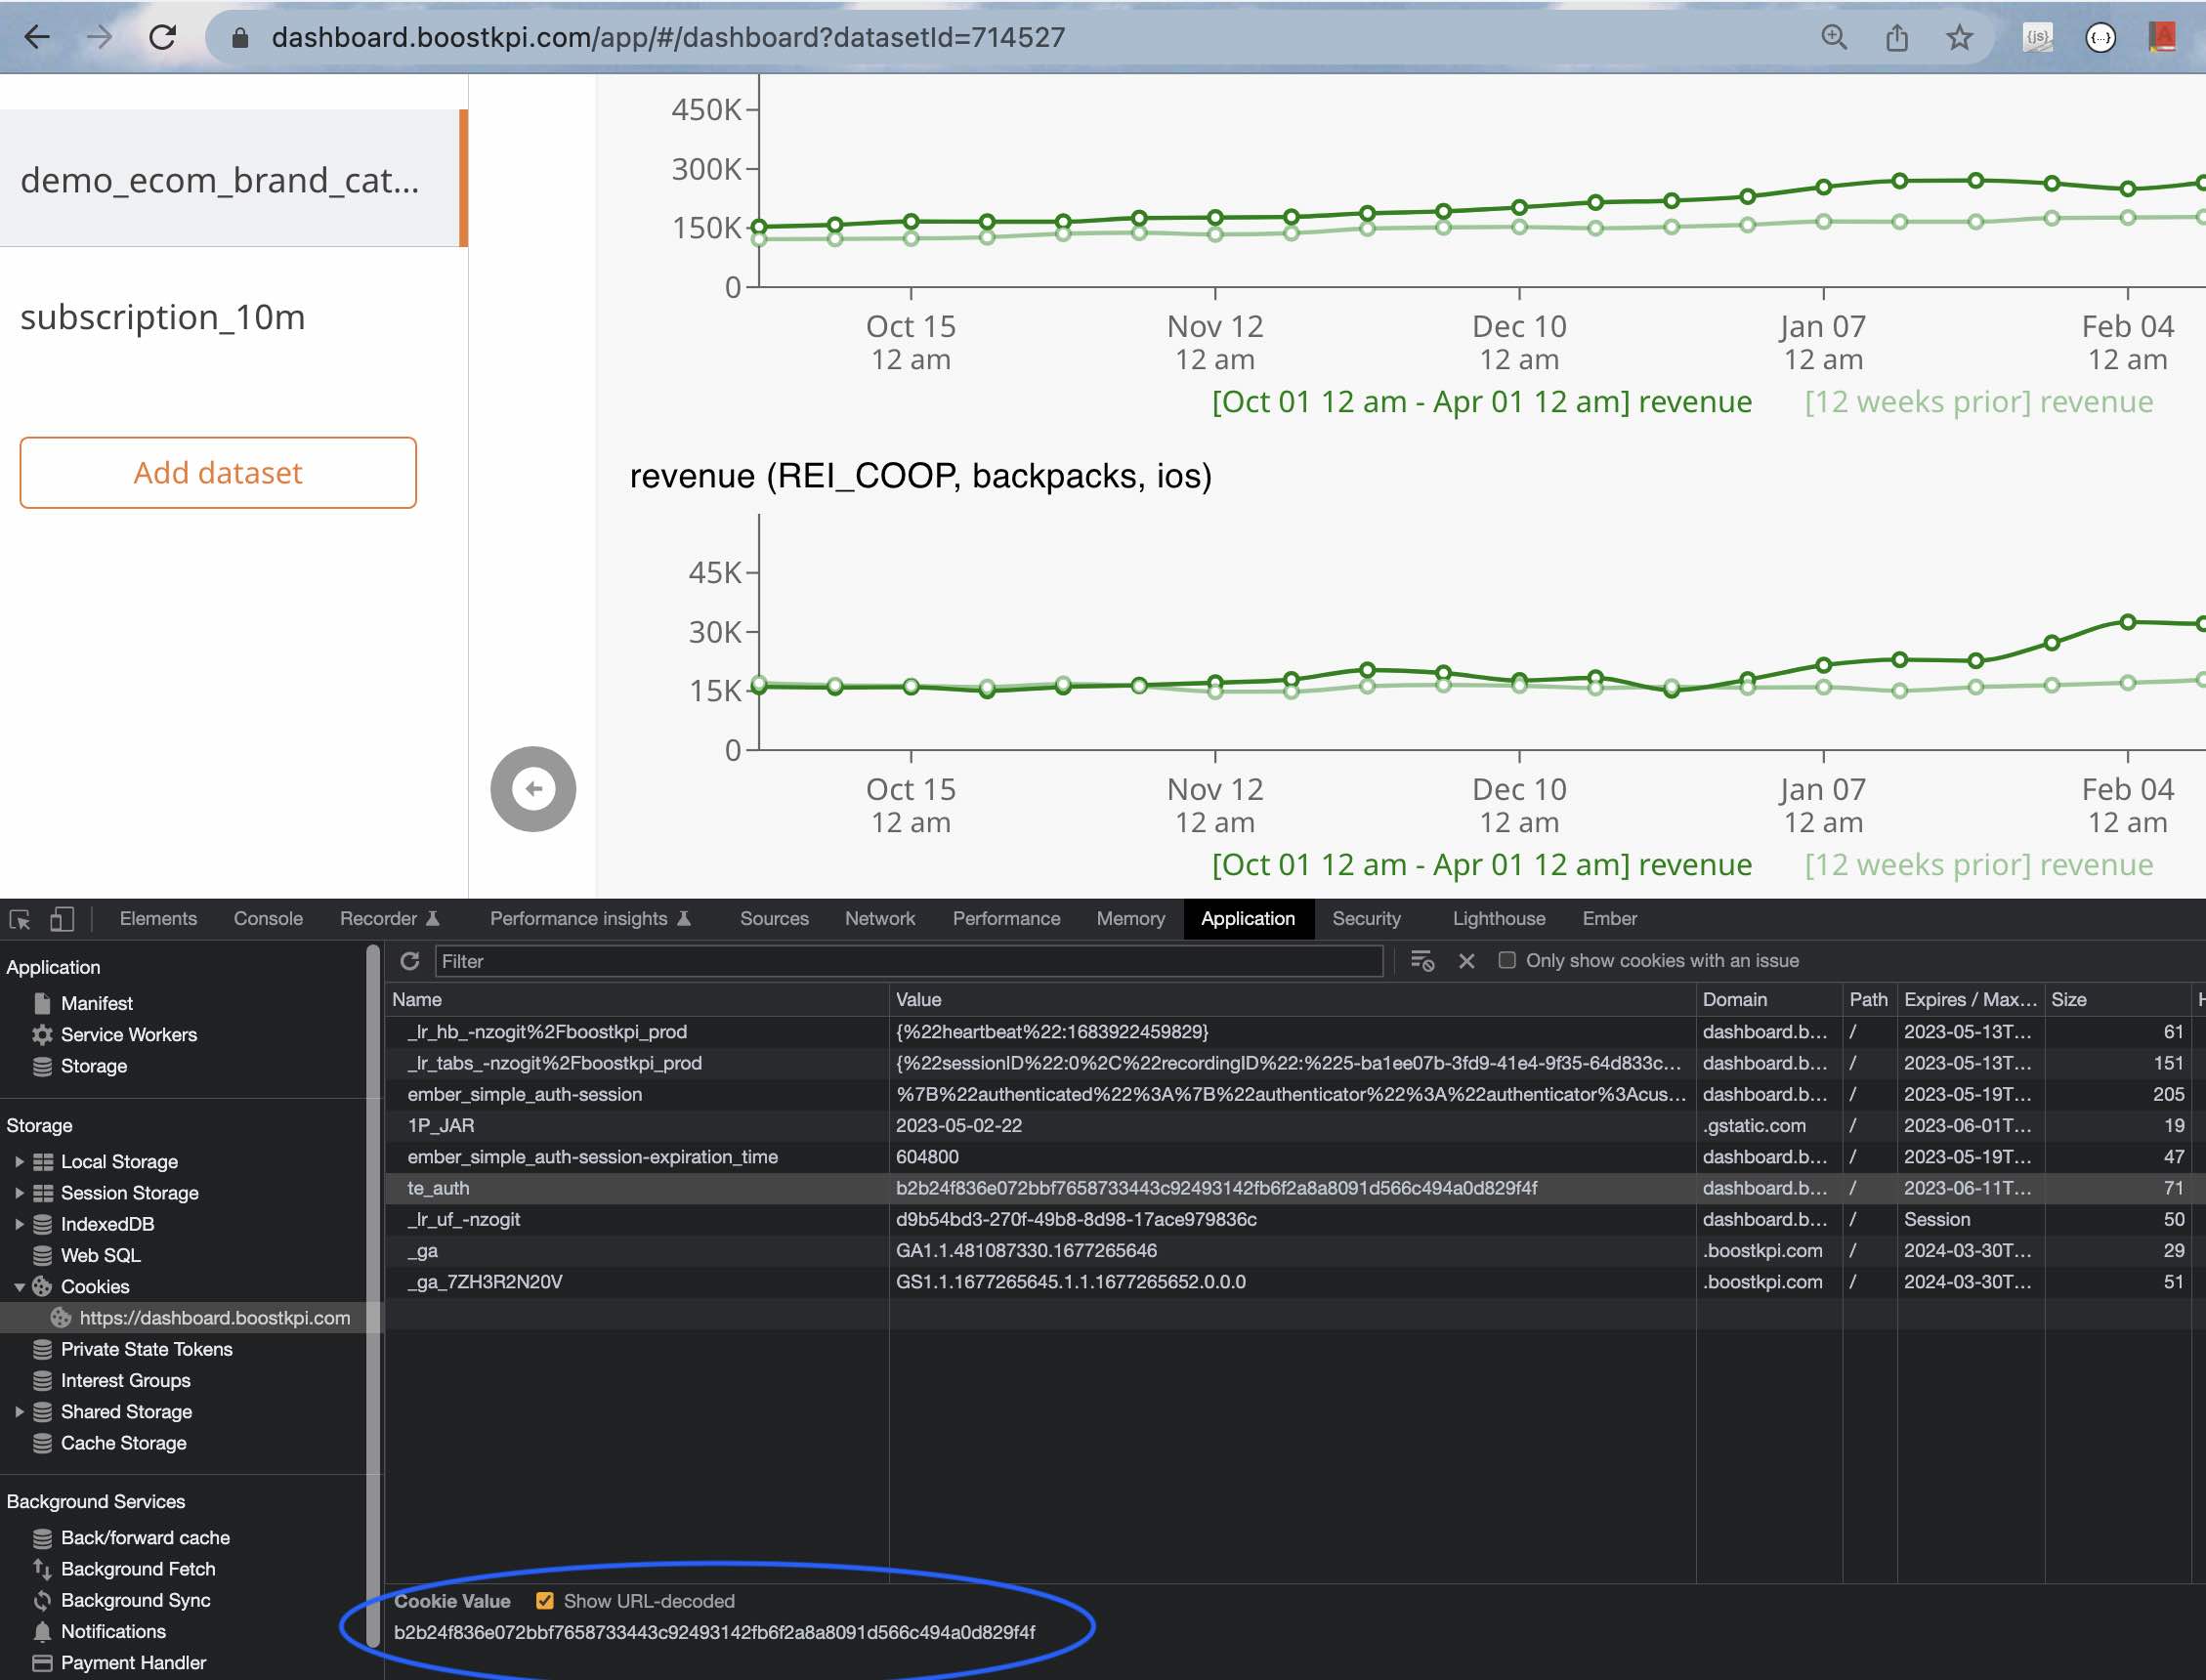
With the cookie set, here is an example request using the tool curl that can be executed on a Mac Terminal.
curl
--cookie te_auth=665ceb3c7272adddfa9f54fd603a6ebed0033a4b5b8391344ab47e756dd59935
https://dashboard.boostkpi.com/api/anomalies/json\?anomalyWindowStart\=1683717689000\&anomalyWindowEnd\=1683917689000