Root-cause chart investigation
Table of contents
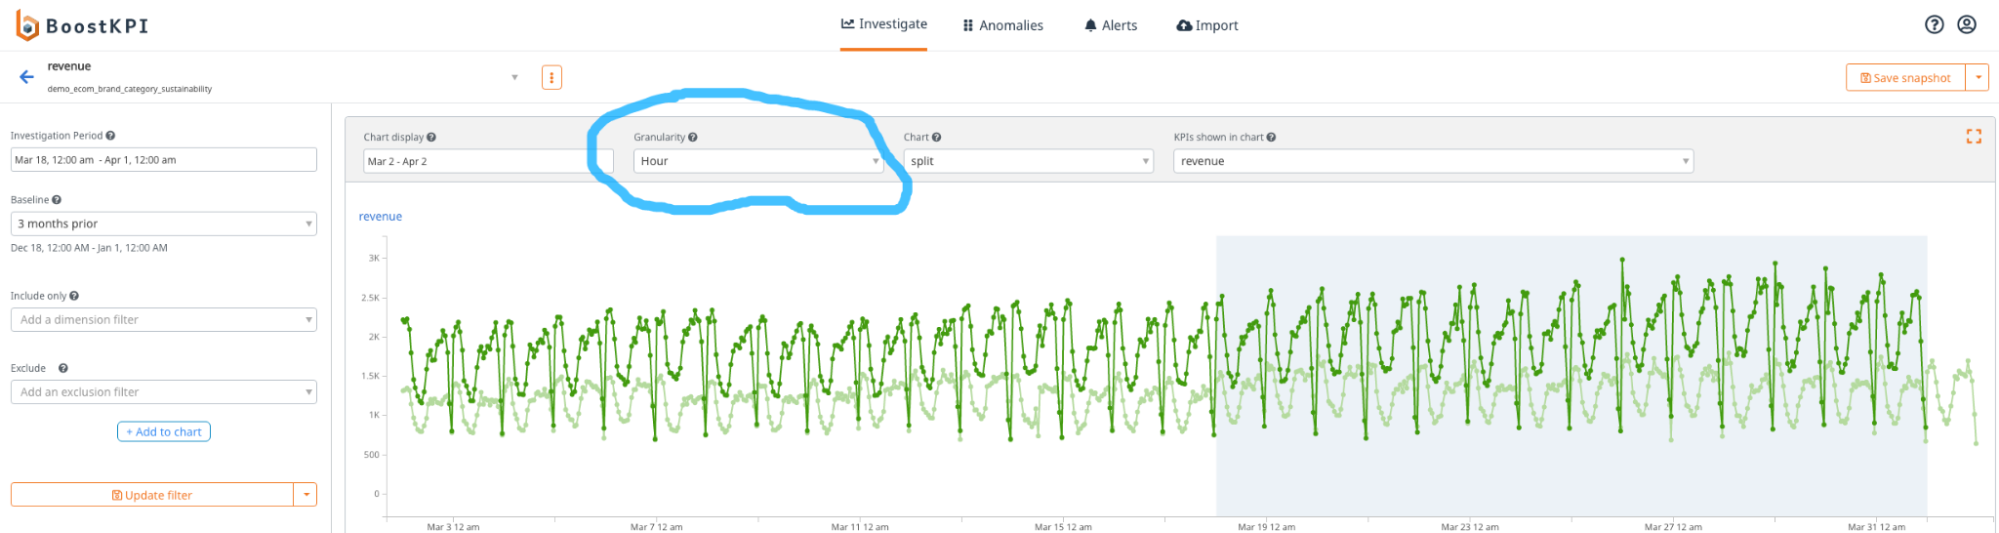
Dataset granularity
You can aggregate your data in a chart for the dataset using the granularity select in the filters above the charts. For example aggregating daily dataset by month.
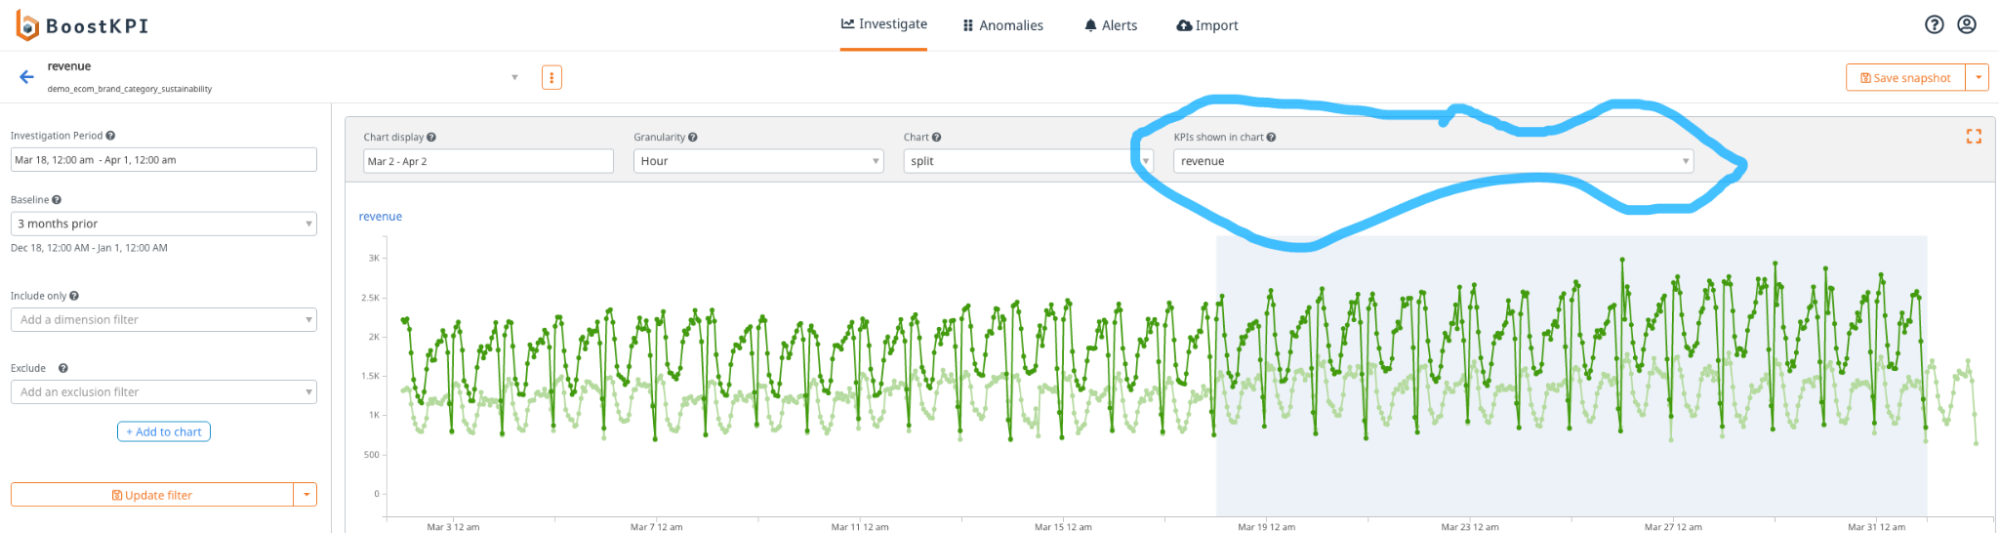
Related KPIs
To view related KPIs on the chart, select the KPI from the KPIs shown in the chart dropdown.
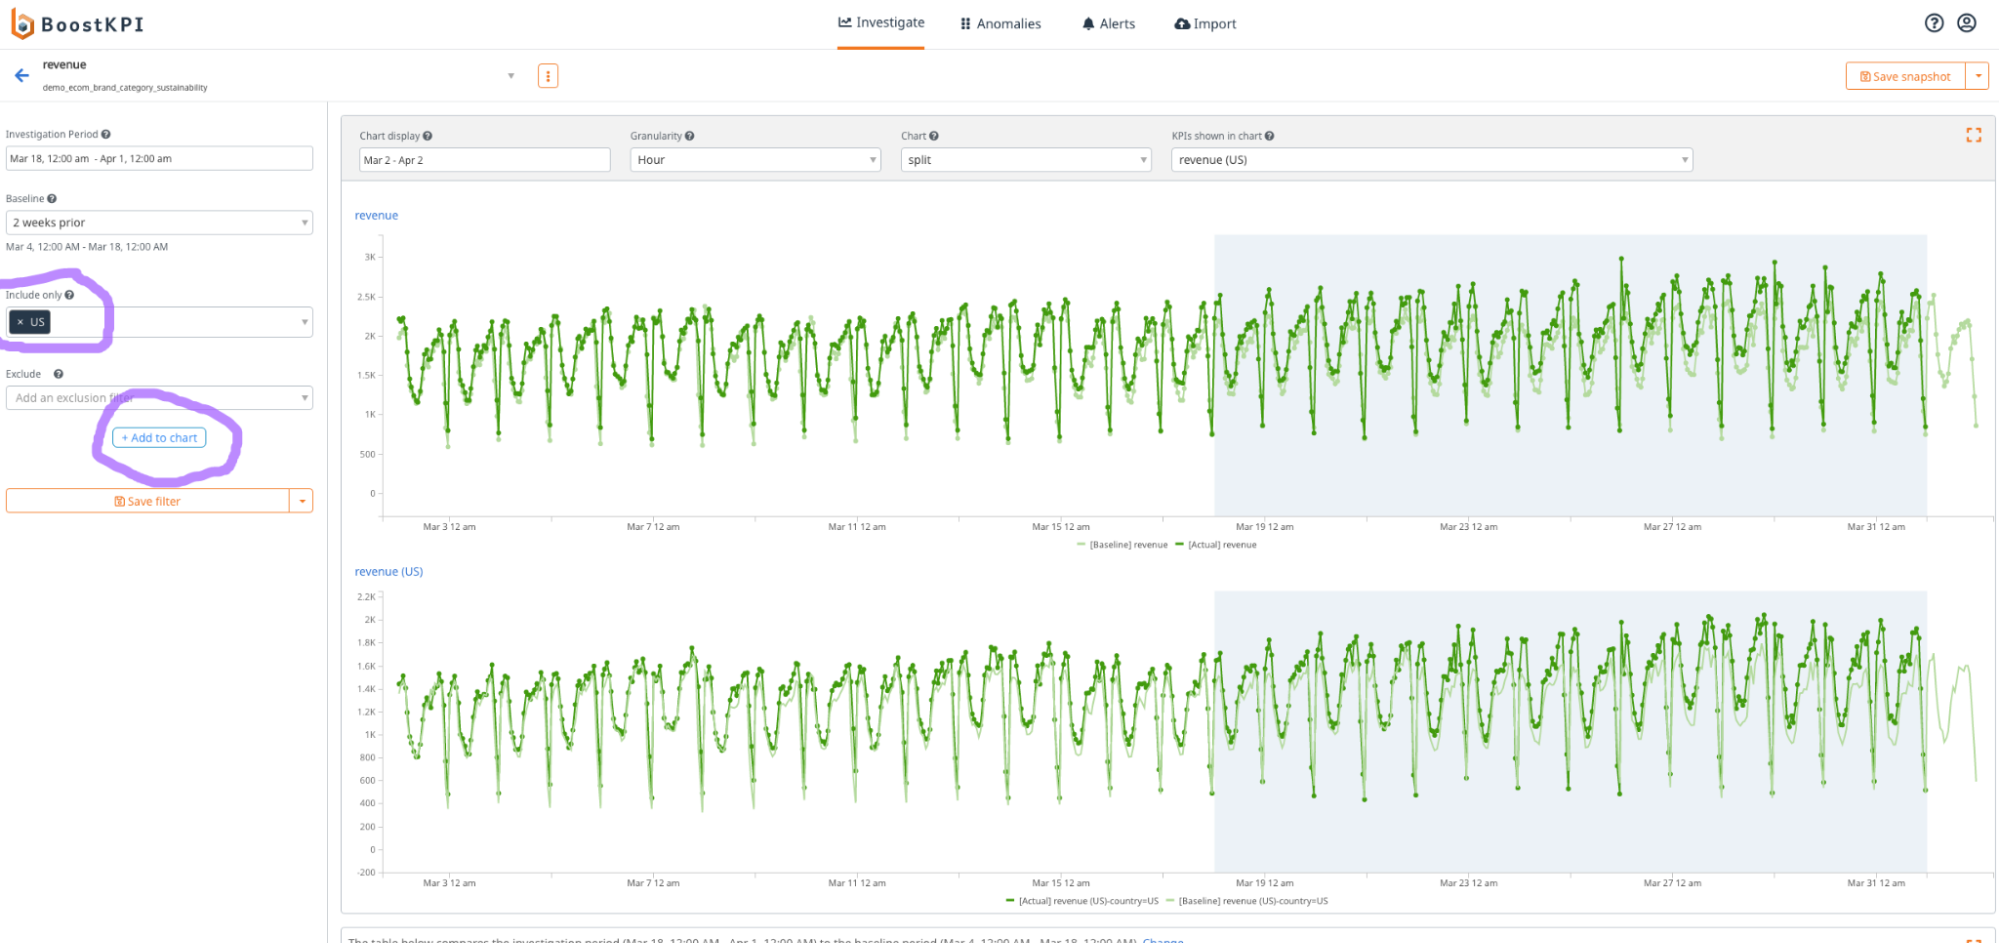
Data filters
To filter the shown data in chart, select the filter using “include only” filter on the left side and then click on “add to chart” button.
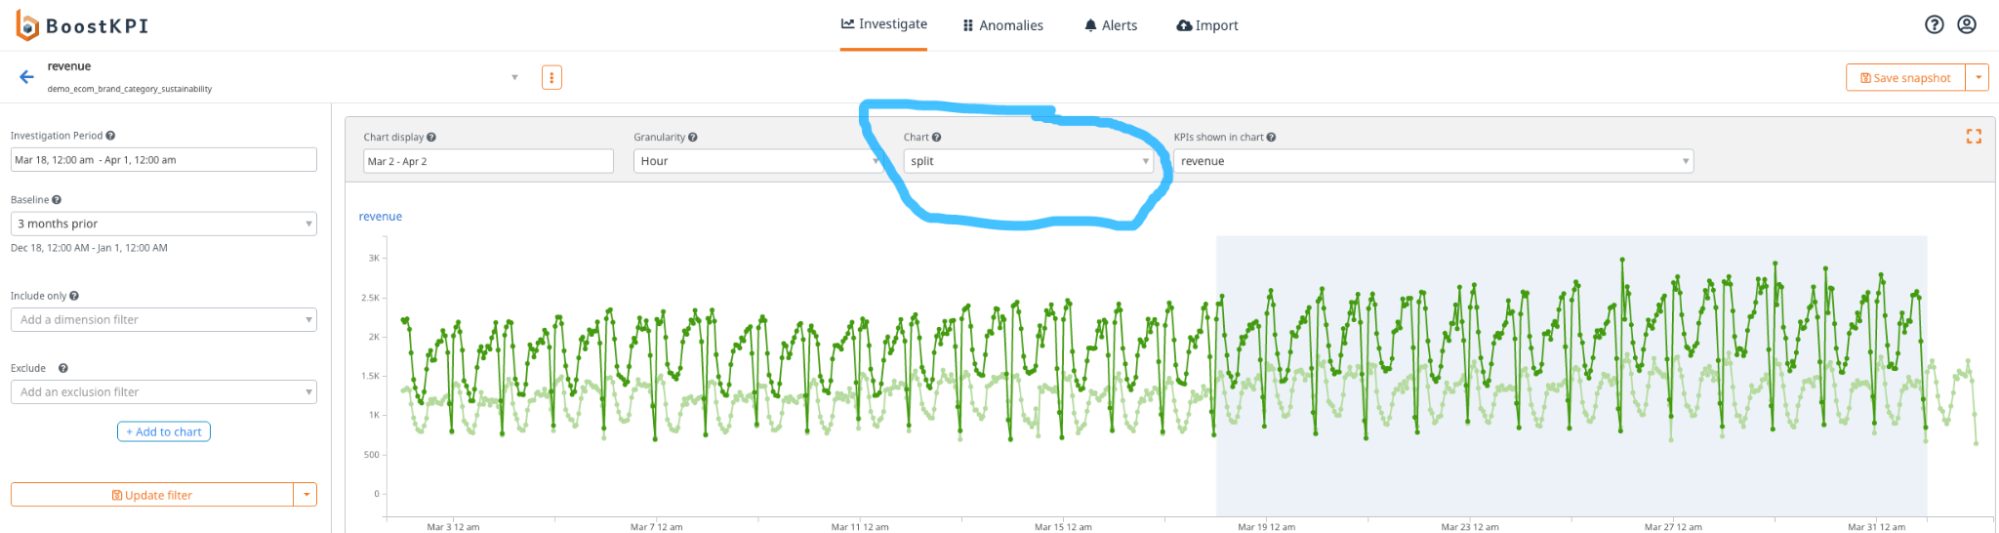
Merging charts into one
You can merge visible charts into single chart using “absolute” option from the chart dropdown.